Interactive Graphics and Maps
Interactive Graphics
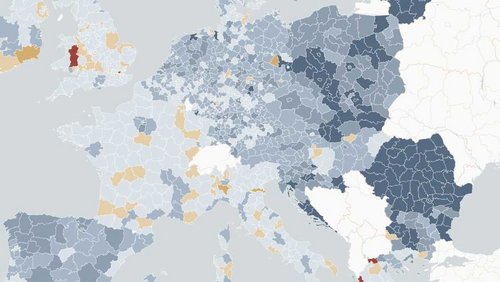
Convergence in Europe: The poorer regions are not catching up anymore
Before the economic crisis, European regions with low economic output per inhabitant grew faster than the wealthier ones. The living conditions on the continent became more similar. Since 2010, however, the process of catching-up has been stopped.
Matthias Diermeier / Markos Jung / Pekka Sagner IW

A lot of recycling, but also much waste in economically strong Germany
In the European Union 482 kg of municipal waste is generated per person. In Germany it is even more, but at the same time considerably more German waste is recycled.
Adriana Neligan IW
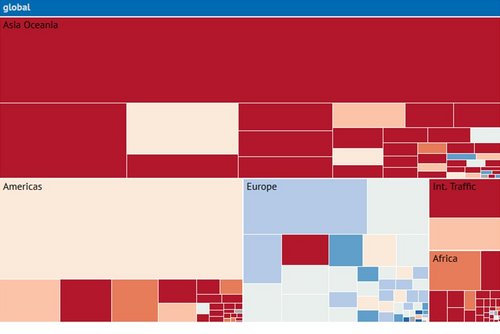
Carbon emissions: A climate balance at a glance
The worldwide rise in temperatures can only be limited if China and other Asian countries also reduce their carbon dioxide emissions. An interactive chart by the Cologne Institute for Economic Research shows the continent’s growing significance for international climate policy.
Thomas Puls IW
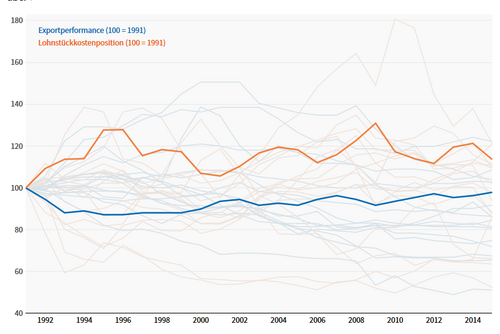
Export performance: Unit labour costs shape international trade
Even Germany, as an export nation, has to compete for shares on its sales markets. The cost for businesses to manufacture goods plays a vital role in this process. This interactive graphic reveals the following: when unit labour costs increase in comparison to the competition, export performance generally declines.
Christoph Schröder IW
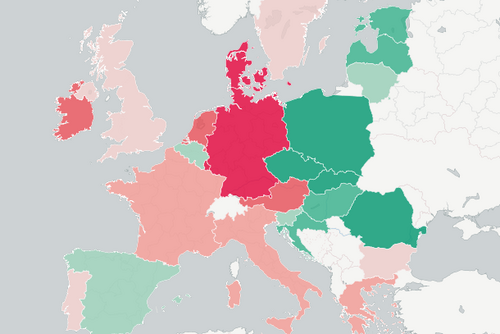
Circular Economy: Germany produces too much rubbish
Every European generates on average 474 kg municipal waste per year. In Germany it is even more, but at the same time more German waste is recycled.
Adriana Neligan IW
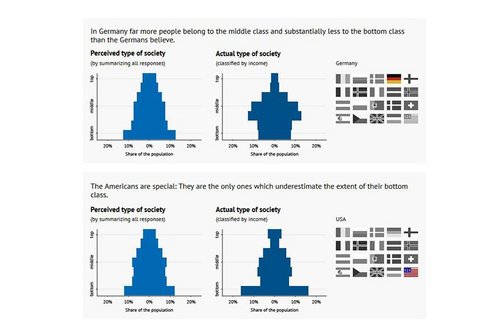
Income: Biased inequality perceptions
Whereas US-Americans are not very concerned about their large income inequalities, Germans view considerably smaller differences much more critically. This is not surprising given that Europeans tend to be considerably more pessimistic about how equal their societies actually are.
Judith Niehues IW
Your search returned an incorrect status. You may have selected too many filters. You can jump back to your previous selection to adjust your search.
With our new newsletters on the following topics you no longer have an IW publication.
We send out our topic-specific newsletters every month.
Register here
With our new newsletters on the following topics you no longer have an IW publication.